Honeycomb 3 - Breaking the API dependency

This is a continuation of Part 1 and Part 2.
So, to recap, we now have data going into Honeycomb, but it's talking directly from the lambda to their API, during the call. And the data going in there is rather messy.
At my pervious job, we had a similar problem - we didn't want each node talking directly to the logging or metrics services, and especially not doing it in a user-facing pipeline.
In that situation, which is mostly EC2- and Windows-focused, getting the logs off each node wasn't too bad - AWS have an agent for CloudWatch Logs, which is fairly low-touch to get log files off a machine. Once they are in CloudWatch Logs, SumoLogic provides a lambda which will export the log stream into their API. It's a fairly elegant and bullet proof system, and we shipped a lot of logs this way.
Thankfully, Honeycomb have thought about the API-call-inline thing, and they have a Lambda which can be hooked up to CloudWatch Logs, and it ships logs to Honeycomb asynchronously. It looks very familiar, which is good.
CloudWatch logs is really handy for Lambda, as it's setup automatically. But it's also very useful if you have a service in a VPC which has no external access - CloudWatch Logs has a VPC endpoint, so your traffic stays off the internet, at least before it goes out of CloudWatch. This is very handy for situations where you need to have a lot of control over your data egress - or no egress at all.
I did have to do two things to get it working. The first was to get the Node beeline outputting in the right format.
This wasn't obvious - I find the docs for the Node beeline a bit lacking in this area, tho the code is pretty easy to read. One of the other users on the Honeycomb Pollinators slack group - Mark Wolfe - pointed at some code he'd written to do this. Turns out, there are examples of this in the API, I just didn't know what I was looking for as it's in the underlying libhoney library, not in the beeline, which is a higher level abstraction.
It's as simple as passing in a class to do the logging:
import honeycomb from 'honeycomb-beeline';

import {config} from './config';

class StdoutTransmission {
  public sendEvent(ev: any) {
    process.stdout.write(JSON.stringify(ev) + '\n');
  }

  public sendPresampledEvent(ev: any) {
    process.stdout.write(JSON.stringify(ev) + '\n');
  }
}

honeycomb({
  ...
  transmission: StdoutTransmission,
});
Apparently, the beeline (or Lambda?) takes overconsole.log, so you have to useprocess.stdout.write.
The astute people out there might also be thinking "well, I could just have it write directly to CloudWatch Logs". True, but then you have to write it.... for a service which isn't already wired up to CWL (Lambda, ECS, EKS?) this might make sense, and you could seperate your events from other stdout logging. For me, it doesn't. Plus, Lambda log collection, as far as I know, happens outside the request, which is the goal here.
I did, however, write a similar class for local dev, were we can output nicely formatted JSON on the local console, which is SO much easier to read then the old, unformatted JSON we got out of structured logs.
Honeycomb has an existing lambda available which can subscribe to a CloudWatch Logs stream and send it to their API. The last step was to make a quick Serverless project to pull down the pre-built binaries, and a Buildkite pipeline to build and deploy it to our environments.
The output looks something like this:
{
    "time": "2020-09-21T20:42:17.693Z",
    "samplerate": 1,
    "data": {
        "meta.local_hostname": "mbp.local",
        "service_name": "graphql-api",
        "name": "GetAllAppointments",
        "trace.trace_id": "0903685",
        "trace.span_id": "680385",
        "GetAllAppointments_ms": 1398.133158,
        "duration_ms": 1398.390158,
        "app.name": "GetAllAppointments",
        "app.userId": "0281234-1234-454b-a346-b271234",
        "meta.instrumentations": [
            "child_process",
            "http",
            "https"
        ],
        "meta.instrumentation_count": 3,
        "meta.beeline_version": "2.3.0",
        "meta.node_version": "v12.16.1"
    }
}
The last steps, which I'm less likely to write about, is retrofitting our existing logging and metrics to use events, which is mostly brute force file editing, with, thankfully, a lot of deleting of code.
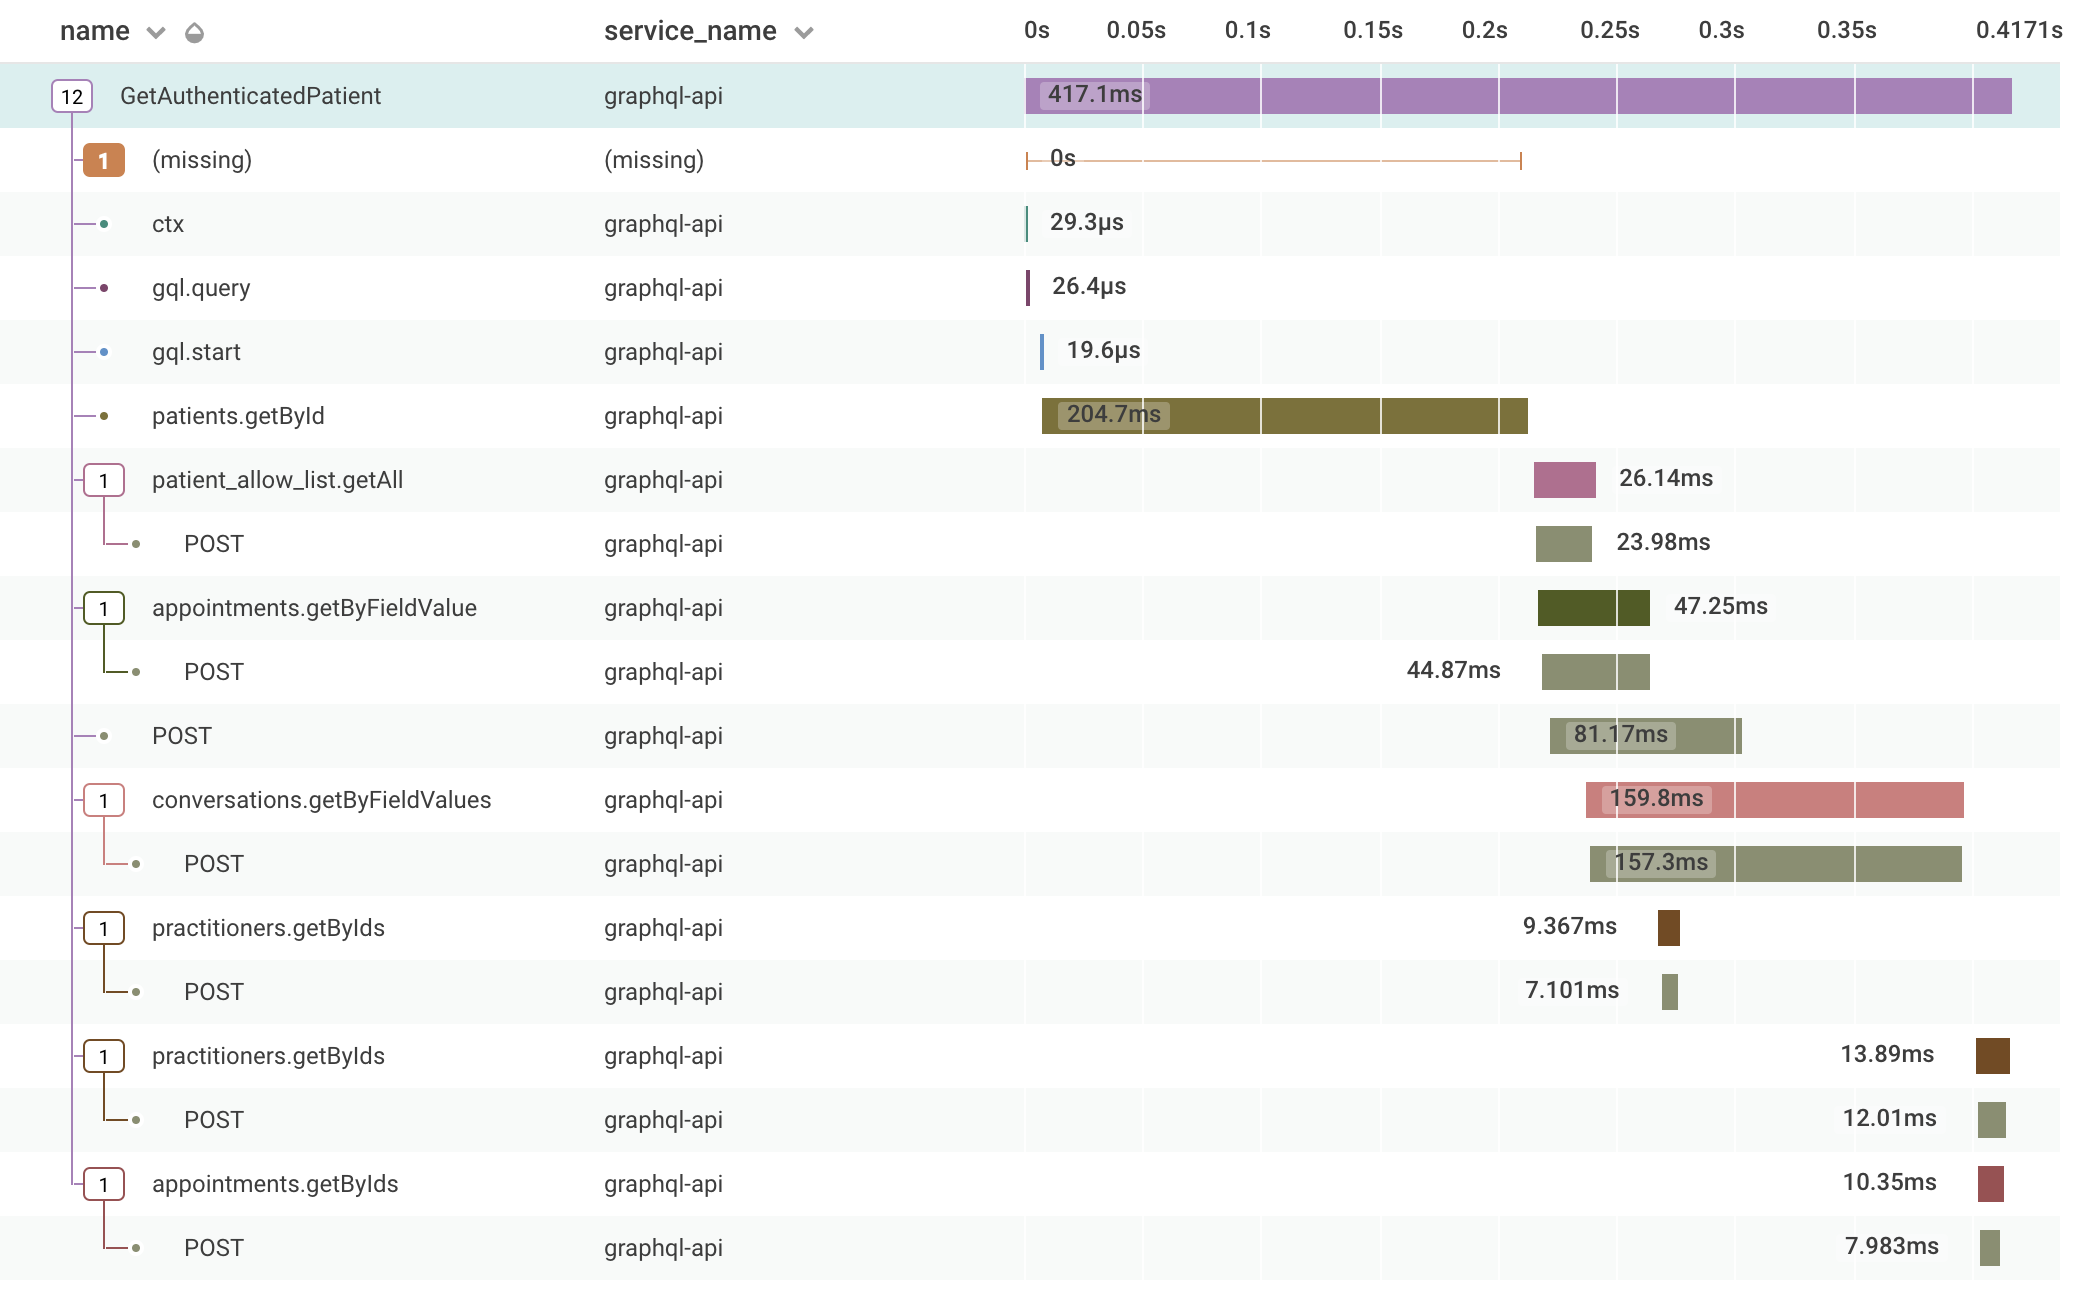
We've had this in for a few weeks now, and it's going really well. I've added some automatic parameter injection, so we get GraphQL parameters auto-added to the root trace, avoiding sensitive fields, and we've added a few more bits which make it a lot easier to answer questions we need. We started out being able to easily answer
- Given a userId, what GraphQL operations did that user do against the API?
- Given a practitionerId (backend user), what operations did they do?
Both of these primary keys come from from the JWT token. However, we couldn't, initially, easily answer
- Given a userId, what operations did a practitioner do on their records?
- Given an appointmentId, what operations did anyone do?
With a few small changes, we can now answer this, which gives us a great visibility into the platform, at least for the moment, until we find new questions we want to answer.