Honeycomb 1 - The Beginning

At Tend, we are just at the beginning of our journey building a scalable, operable platform to help New Zealanders become the healthiest people in the world.
At the moment, we are using a combination of AWS CloudWatch Logs and CloudWatch Metrics to get an insight into what the production platform is doing. These were chosen for two reasons: they integrate into Lambda really easily, and they were there.
While I don't hate them, I can't say I love either one either, especially after using other log and metrics tools at my previous job. As we are greenfields, or very close to it, we decided to look into Honeycomb.
There's a general movement towards observability (011y) at present, with the charge being led by people like Charity Majors - who is the CTO/Co-founder of Honeycomb. Even with a limited background in observability, getting my head around how Honeycomb works took a bit of doing.
The before
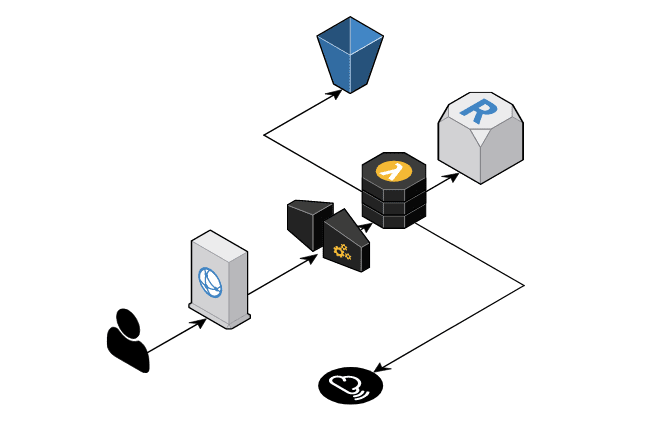
Our architecture, at present, is fairly simple. We have an app and website (SPA), which communicates to the back end over HTTPS using GraphQL. We front the GraphQL service with CloudFront and API Gateway, and the actual service is a single lambda function which we lovingly call the Lambda-lith. Data sits in either Aurora Serverless (Postgres) or S3, and we talk out to a few external services, most notably Tokbox, Twilio and Stripe. None of it is pushing the envelope too far, tho it's proving to be great for very rapid, end to end (urgh, full-stack, hate that term) development.

I had implemented a basic structured logging and metrics system already, using the Dazn Lambda Powertools logging module, and aws-embedded-metrics. These are fairly easy to use, and have the advantage of being driven from CloudWatch Logs - so there is no "wait for the collector" step at the end of the lambda runtime.
We did have a load of helper code to do this tho, which made retrofitting Honeycomb a bit easier.
Getting something in
The first step was getting something - anything - into Honeycomb. They provide a library - a beeline - for Node, which makes it quite easy to setup. Once I got a module loading issue out of the way, it was fairly easy to get some of our existing metric injection points set up to also log into Honeycomb.
Side note: Join the Honeycomb Pollinators Slack group if you sign up for an account. It's low traffic and very useful and informative.
I built a wrapper which setup the beeline, and made sure it was done once on the first call.
import honeycomb from 'honeycomb-beeline';

import {config} from './config';

if (config.enableHoneycomb) {
  honeycomb({
    writeKey: config.honeycombWriteKey,
    dataset: config.honeycombDataset,
    serviceName: config.honeycombServiceName,
  });
} else {
  honeycomb({
    writeKey: '',
    dataset: config.honeycombDataset,
    serviceName: config.honeycombServiceName,
    impl: 'mock',
    disabled: true,
  });
}


export const beeline = honeycomb();
After that, the usage is as simple as
import beeline from './util/honeycombWrapper';

...

const export func = () => {
  const span = beeline.startTrace('Doing Something');
  ...
  beeline.finishTrace(span);
};
We are already using a middy-based middleware setup, so I just added a new middleware into the stack, which setup the first trace.
import {beeline} from './honeycombWrapper';

export const honeycombMiddleware = () => {
  let span;
  return {
    before: (handler, next) => {
      const {event, context} = handler;
      //we rename this as soon as we know the GraphQL operation name
      span = beeline.startTrace({name: 'lambda'});
      return next();
    },
    after: async (_, next) => {
      beeline.finishTrace(span);
      await beeline.flush();
      next();
    },
  };
};

... elsewhere ...

export const useMiddleware = originalHandler => {
  return (
    middy(originalHandler)
      .use(honeycombMiddleware())
      .use(correlationIds({sampleDebugLogRate: 1}))
      .use(metricsMiddleware())
      .use(metricsTimingMiddleware())
      .use(versionCheckMiddleware)
      .use(httpApiMiddleware())
      .use(httpErrorHandler())
  );
};
With this in there, we started to get data into Honeycomb. This has a few problems tho, the main one being that the call at the end to await beeline.flush(); will wait while it sends the data to the Honeycomb API before returning data to the use.
In AWS, this is about a 30ms delay, but we are now reliant on their servers being up and performant. I have confidence that their engineers and SRE's know what they are doing (ahem LizTheGrey <3 ), but incidents happens, and it's a direct dependency I'd prefer not to have.

However, at this point, we were up and running in dev, and data was flowing into Honeycomb, so it was enough to work out if it was useful.
In Part 2, we'll have a look at some of the terminology changes between normal logging-and-metrics and honeycomb.